

Calculating return on investment is essential to digital marketing in 3 ways:
- It justifies the work you’ve done;
- It shows what has and hasn’t worked; and
- It allows you to set targets moving forward.
Without this metric, we have no way of knowing where our time, effort and money are best-placed. Yet, few SMEs seem to place much emphasis on working it out at every stage of the buying and selling process, leaving many ‘black holes’ where money or opportunities could be lost. We see this very often in the world of digital marketing.
In this blog post, I aim to explain how to use Google Analytics and Excel/Sheets to work the ROI of your website and what is really making or not making you money. While consumer behaviour is hard to measure, we can start to build a picture of what is and isn’t making you money using GA:
Contents
Getting Set Up
Before we can work out how your E-commerce store is performing, first you need to set up the following:
- Install Google Analytics on your website (guide);
- If you’re running Google AdWords ads, link Analytics and AdWords (guide);
- If you’re running paid ads outside of AdWords, set up custom campaign URLs;
- Import cost data into Google Analytics (guide);
- If your primary focus is lead generation, set up an enquiry spreadsheet and fill out the values of previous enquiries (guide);
- If you’re running an E-commerce store, set up Google Analytics E-commerce Tracking (guide).
Return on Ad Spend (ROAS)
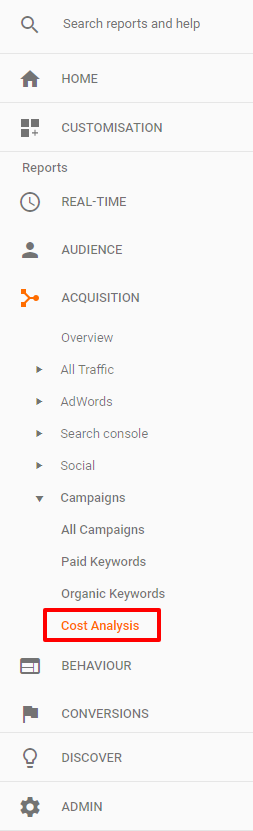
Once you’ve got all of the above set up, head over to the Cost Analysis report in your Google Analytics view. It can be found under Acquisition > Campaigns
If you’ve imported your cost data, you’ll be able to see a Source / Medium list of the campaigns you’ve run. If you set ‘Campaign’ as the primary dimension (as highlighted in the screenshot below), this displays the campaigns you’ve run along with the amount of Revenue (or enquiries) they lead to:
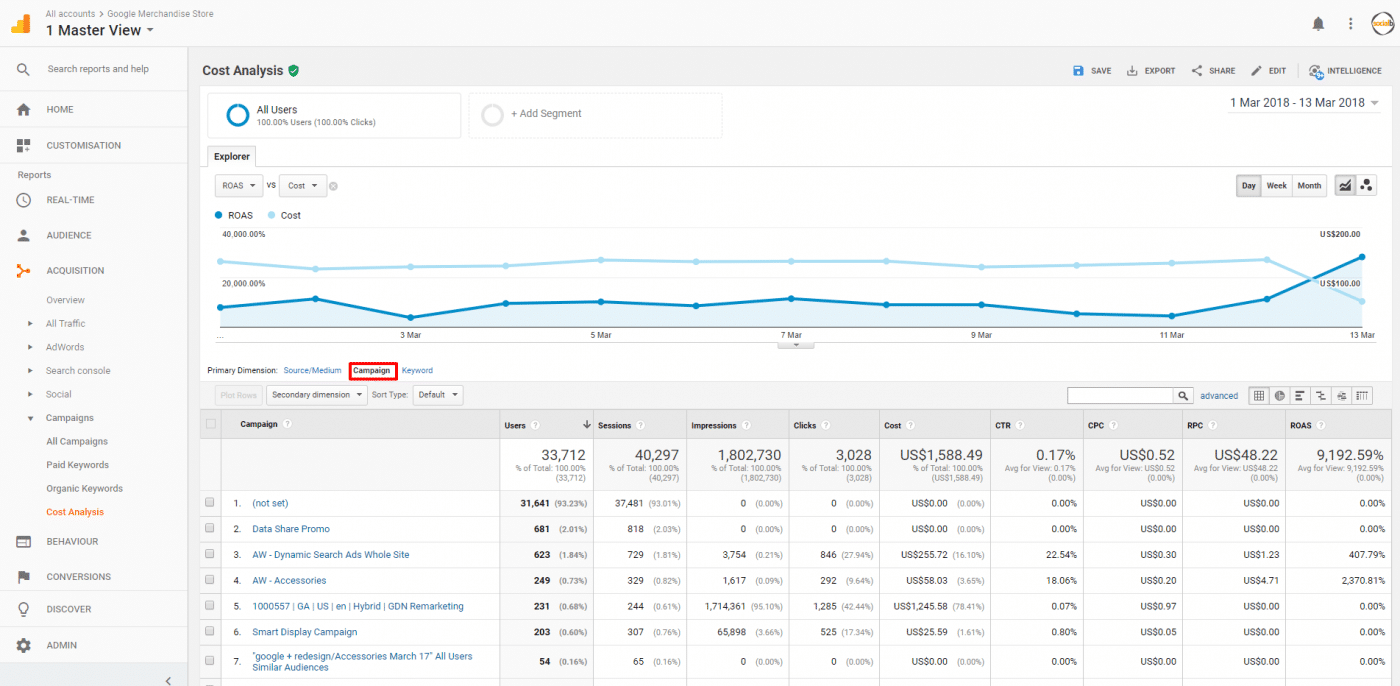
In the case of enquiries, you can add ‘Hour of Day’ as a secondary dimension and pair these records up with your enquiry spreadsheet (as described in this guide) to gain an idea of ROI of each campaign.
But What About Profit?
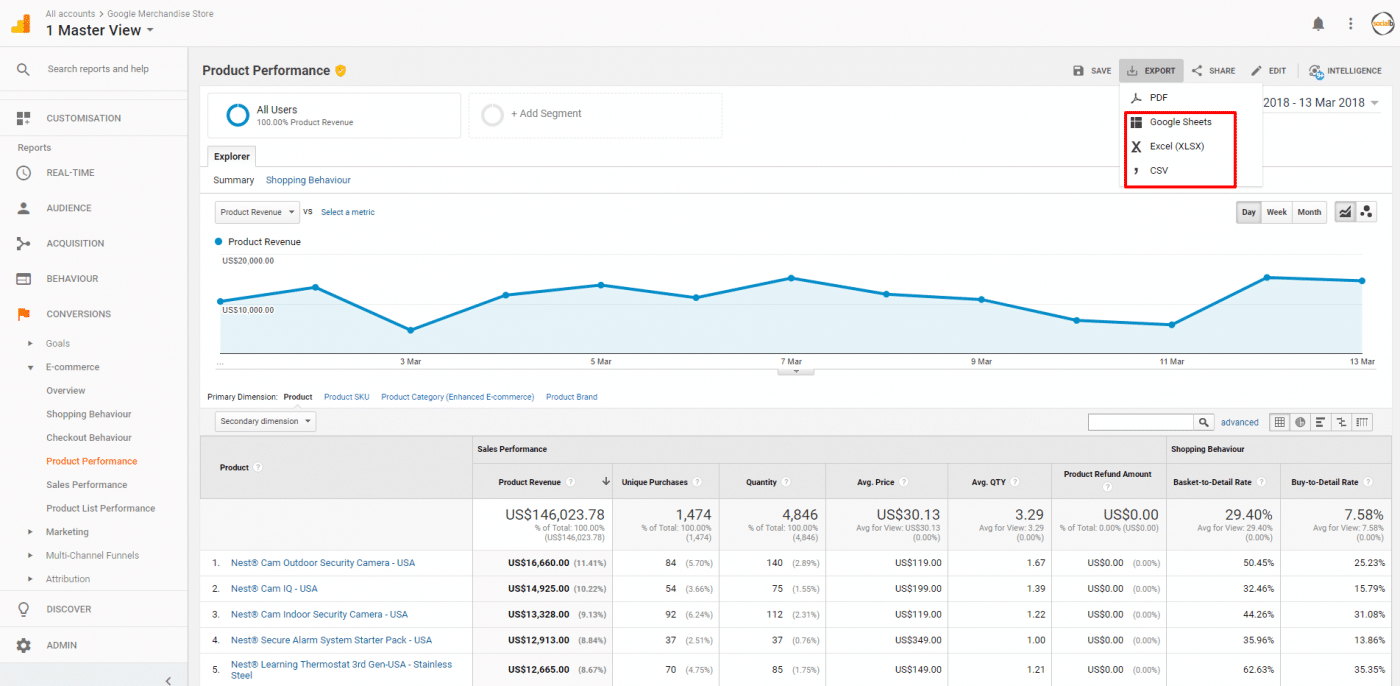
Profit is much harder to calculate. In order to calculate this using Google Analytics, you’ll need to head over to Conversions > E-commerce > Product Performance and export the report to either a Google Sheet or Excel workbook where you can match-up your product cost and markup numbers with the data from Google Analytics:
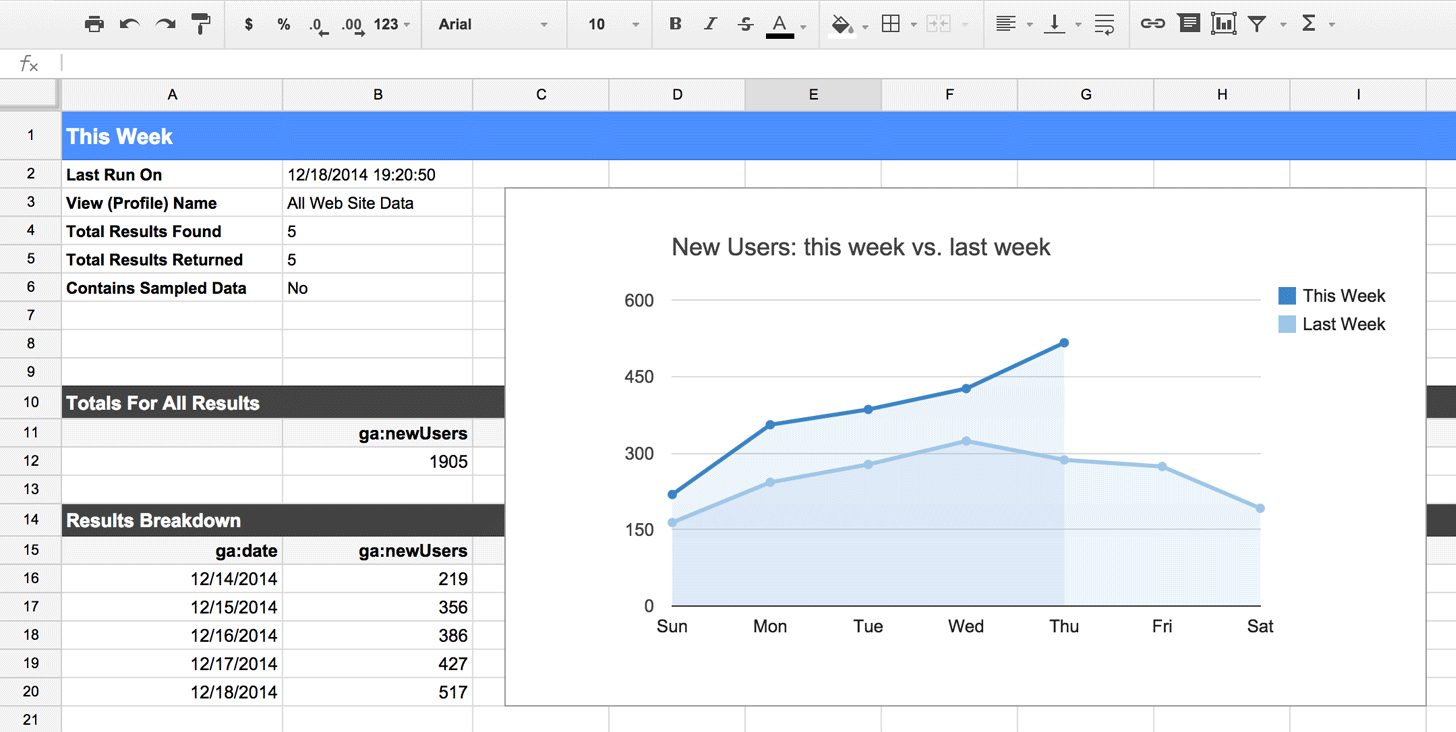
Another option would be to use Google Sheets Google Analytics add-on. This allows you to pull through product performance data on a schedule:
Another option outside of Google Analytics would be to add product cost data into your website’s CMS. WooCommerce has an official extension for this and Magento an unofficial one from aheadworks. You’ll still need to collect cost data to use in your ROI equation, so Google Analytics’ Cost Analysis could be used for this also, whether manually exported or automatically using the Google Sheets Google Analytics add-on.
Why Isn’t This Easier?
I completely agree! Working out ROI isn’t as simple as it should be, but hopefully this guide will give you something to start with. If you have a WooCommerce or Magento store, do take a look at the extensions linked above, they can help give you a better idea as to how your store is performing. If you have any questions in the meantime, please feel free to get in touch and we’ll see how we can help.


1 comment
Thanks for sharing an useful information.