
As marketers, we spend an awful lot of time wondering what our customers want.
Or if you don’t, well, you probably should.
But how can we know for sure what our customers need to convert?
We’ve all been there. Giving our customers everything we can possibly think of and more, and yet they still favour the competition.
How do we find the hole in our ship and plug it?
The answer is an awful lot easier than you may think.
Become a customer.
Take off your marketer’s hat for a second and step into your shopper shoes. Go through the customer journey with fresh eyes and you’ll probably find the issue.
But that begs the question, what is the customer journey, and how do I analyse it?
Well, fear not intrepid explorer of conversion rate optimisation techniques, because this guide holds the answers and will lead you gently down the path to happy clients and improved conversions.
Ready? Good. Let’s go.
What is the customer journey?
Think of every single experience a customer has with your brand. Not just a singular transaction or digital run in, but everything, the whole shebang.
That is the customer journey.
The customer journey starts from the very moment a person becomes aware of your brand, even if that’s just seeing a logo somewhere, and doesn’t stop until they forget about you completely (which obviously we hope wouldn’t happen).
Here’s an example customer journey. Every time there’s a point which can be considered, understood and optimised to create a successful experience, we’ll give you a little nudge:

Yep, that’s an awful lot of nudges.
You can clearly see how important it is to stay sharp and keep an eye out for all the tiny instances in which your customers are making decisions and forming opinions, all of which can have an impact on how likely they are to convert.
That might seem like a daunting prospect at first, but all it takes is a little organisation (and some handy metrics) to make things feel more manageable.
A Word on Data Analysis
Before we get to the really juicy bit of this guide and show you how to effectively analyse the customer journey, we need to strongly recommend that you use Google Analytics (or an analytics solution of your choice) to keep track of the traffic on your site.

Without the valuable insights provided from these programs, we’d essentially just be guessing at what’s going on.
As much as we like to think that we know our brands inside out and can easily identify any weak points, this can often be the problem when it comes to missing things on the customer journey.
The data provided by analytics gives us a totally unbiased view of how customers are interacting with the site, removing the guesswork completely. So don’t play pin the metric on the behaviour report, just get analytics set up and you’ll know for sure where any potential problems may be.
Now, on to the piece de resistance;
The Most Important Metrics for Analysing the Customer Journey
Exit Rates
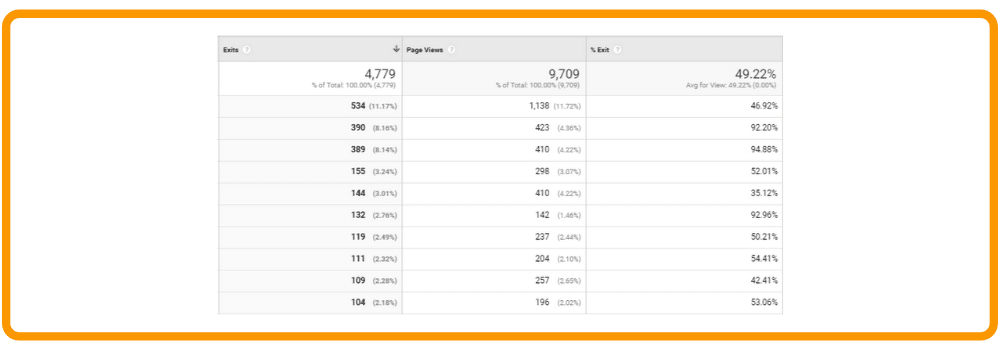
We appreciate that this might sound obvious, but checking where your customers are leaving your site is a really big indicator of where your problems may be.
The conversion process needs to be as smooth as possible for the customer, so even the smallest hurdle can cause them to abandon the process and go elsewhere. It could be something as simple as the next required action being unclear, such as a poorly placed “proceed to checkout” button.
If you’re tracking a page in Google Analytics, then you’ll be able to see the Exit Rate for it. Put simply, this is the percentage of views on a page that end with the visitor exiting the site entirely.
If you have a page with an above average exit rate, then you’d better believe that there’s probably something wrong with that page.
So what do you do?
Well, first thing first is to have a look at the content on the page and see if there’s anything there that could be causing people to leave.
Is the information relevant?
Does it meet the user’s expectations?
Can visitors clearly see what they have to do next?
This last one is a biggy, if people don’t know what’s required of them then they’ll drop the page in a flash and find an alternative (ie, a competitor).
To find this report in Google Analytics, go to Behaviour > Site Content > Exit Pages.
Exit rates – a disclaimer
So we know what we said earlier about how a high exit rate = a bad page, but this isn’t always the case. A page may have a high exit rate due to it being the natural conclusion of a customer journey, such as the order confirmation page. In these instances a high exit rate is to be expected, and really not something to worry about, so keep the context of your pages in mind when analysing the customer journey.
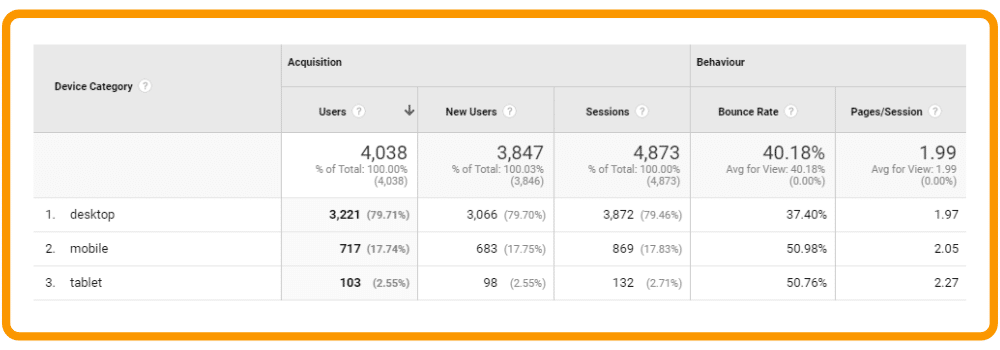
Performance by Device
Last year Google started their mobile-first index.
This basically means that no matter how good your desktop site is, if it isn’t mobile friendly, it’s going to slip down the rankings.
That’s one big reason to make sure your site is easy to use on the small screen, but it can also massively impact on your conversion rate and customer journey.
If an increasing number of people are accessing the internet via their mobile devices, and your site is difficult to use, then how many potential customers are dropping off the journey?
Google analytics can show you how many people view your site from each device type, so you should easily be able to separate the data and notice if there’s a problem somewhere. If you do find that you have an exceptionally high bounce rate on mobile devices, well then you’d better get optimising!
To find this report in Google Analytics, go to Audience > Mobile > Overview.
Ranking URLs
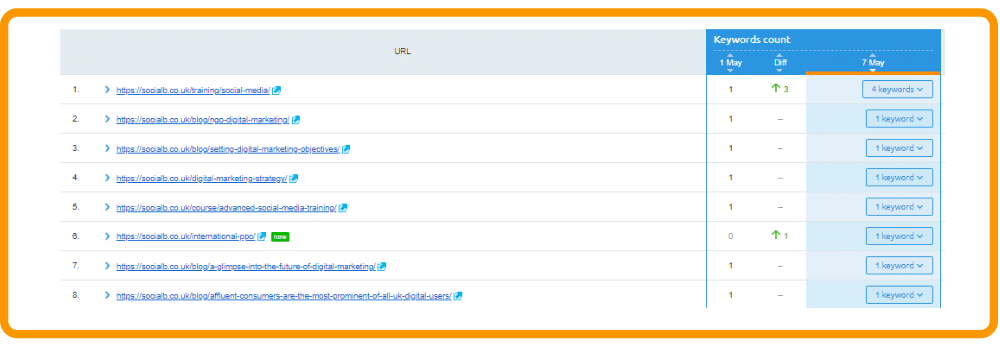
It’s worth making sure that the pages visitors are landing on are definitely the most relevant.
The search engine is going to dictate which URL is ranked highest for a given search, your job is to make sure that it picks the right one.
Ever searched for a specific product, clicked on the top result and just been taken to the site’s homepage? It’s frustrating and will likely result in a hasty bounce.
Avoid these issues by employing the tried and tested use of Search Engine Optimisation (otherwise known as SEO).
This will convince the search engine to select the URL you want it to, instead of sending visitors to the wrong place.
You can keep track of where your URLs are ranking in one of two of ways. There’s the manual option, simply performing searches yourself and taking note of where you’re ranking, or you can use rank tracking tools such as Accuranker or SEMrush.
It’s up to you!
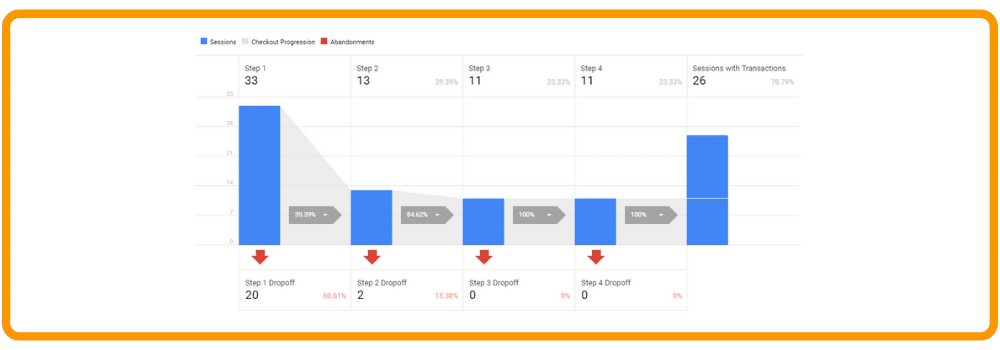
Conversion and Goal Analysis
Consider the usual process of purchasing something via a website.
There’s usually a whole bunch of pages to go through, right?
From adding things to your cart to entering your details to selecting delivery and beyond, there are a lot of steps to the process, and you’d like to think that once a customer starts on this path that they’ll see it through.
Well, we hate to break it to you, but that’s often not the case.
So long as you have everything set up properly in your Analytics, you can generate a “funnel report” which will show you how many people start to convert, and how many actually do.
If you see that a disproportionate amount of visitors abandon their purchase after a certain page, then you may want to take a serious look at that page and address any issues that you find there.
To find this report in Google Analytics, go to Conversions > E-commerce > Checkout Behaviour.
Internal Search
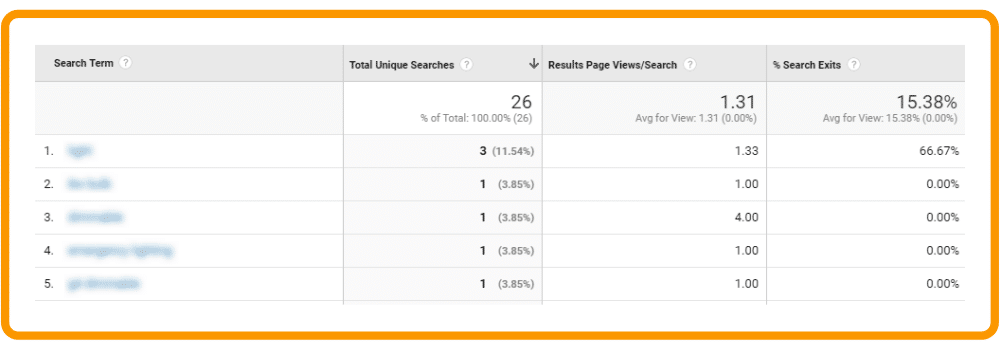
If your site has its own internal search function, then you have a wealth of data about your customer journey just waiting to be tapped into!
What people are searching for on your site gives a massive insight into where you could be falling down.
If you provide a service or product that people are frequently searching for, then perhaps customers are having a hard time finding it.
So long as your site is well designed and the content is relevant and accurate, then visitors may not actually need to use your search that often. Make sure that the pages with the most popular searches are prominent and easy to find. If they’re not, then you can expect people to drop off, and then you’ve lost them.
To find this report in Google Analytics, go to Behaviour > Site Search > Search Terms.
Summary
That’s a lot to chew on, we know.
But if you go through these 5 metrics carefully then you’ll have a much better chance at seeing your site through your customer’s eyes, and what could be more useful than that?
An effective digital customer journey analysis not only allows you to understand your customers better, therefore creating stronger bonds and increased loyalty, but it also helps to reduce complaints, define successes, increase overall website performance, cut costs and (most importantly) increase revenue. It’s a win on multiple fronts, so we’d strongly recommend it to any business.
What now?
That’s up to you.
You can try and find the time to dedicate to an in-depth customer journey analysis and do it yourself, or you can ask about our marketing strategy services and get us to look into it for you.
We love this stuff – seriously- and have a ton of experience with making sure our client’s and their customers have the sleekest journeys imaginable.
If you’ve found this guide useful or have any further questions, then please do pop a comment below. We’d love to hear from you!